Visualizing speed in winter sports (2018 PyeongChang Olympics)
In this post, I visualize speed in winter sports such as speed skating and sledding that took place during the 2018 PyeongChang Olympics.
March 03, 2018
The 2018 Winter Olympics in PyeongChang has showcased dazzling athleticism from participants across the globe. But being new to winter sports, I found myself childishly curious of especially one thing while watching each event: How fast are these people actually going? In this post, I visualize some of the data collected during the Olympics to gain a more intuitive understanding of speed in winter sports.
Speed per sport
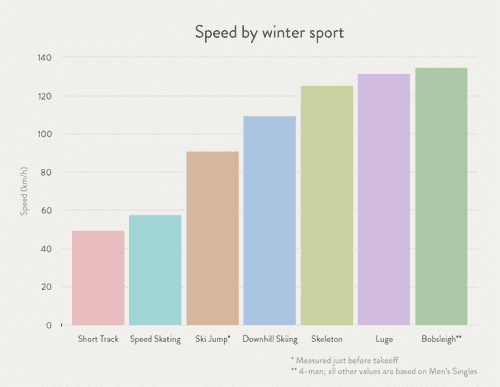
It should be noted that these values aren’t the peak velocities of each sport observed during the entirety of the Olympics. They are rather roughly the top speeds, approximated by looking at the gold medalists’ records in their final runs.
Speed is not a metric constantly measured throughout each event. Consequently, I took the highest speed from the data that does exist (from the gold medalists’ final runs). In lap-based events, such as speed skating and short track speed skating, I divided the track length by the fastest lap time. In sledding events, speed is measured, but only at certain points throughout the heat. I took the fastest record of these, which in accordance with intuition is the speed measured at the finish line.
Nevertheless, the graphic should provide some insight into the sheer speeds winter sport athletes experience.
Speed skating—lap time distribution (Men’s 5000m)
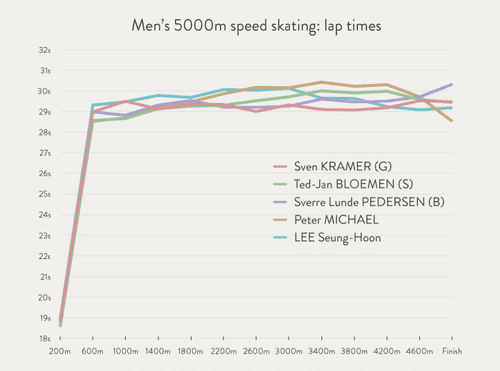
From this plot, we can see how athletes follow different strategies when distributing their energy throughout an exhausting long-distance race. Pedersen (NOR) invested heavily in the initial phase of his race, tiring out by his final laps. The gold-medal winner, Kramer (NED), maintained consistency throughout. The other three athletes, especially Michael (NZL), saved their energy for the last—or possibly gained a spurt of stamina as they saw the end approaching.
Speed skating—average lap time by race length (Ladies)
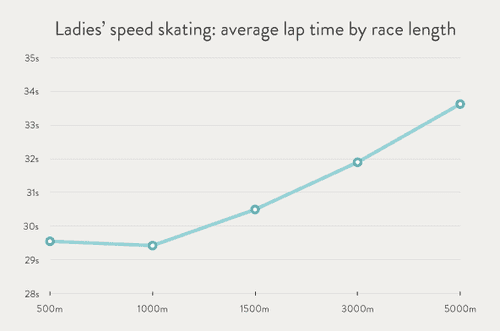
From the stationary point around 1000m, we can deduce that speed skaters are able to sustain nearly top-speed for up to 1000m, but are not able to do so in lengthier races.
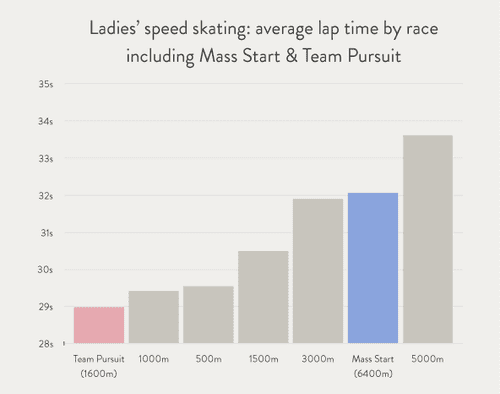
Speed skating—average lap time including Team Pursuit & Mass Start (Ladies)
Surprisingly, Team Pursuit, a team event (hence the name), exhibited significantly faster average lap times than individual events. With my limited understanding of speed skating, I could think of two explanations for this phenomenon: (1) in team events, skaters cooperate to share the burden of air resistance; and (2) in team events, skaters do not need to alternate between “in” and “out” courses, and thus follow the shorter “in” course for the majority of the race. The latter probably has greater significance, judging from the fast lap times in Mass Start, an individual event without course alternations.
Skeleton—record by heat (Men)
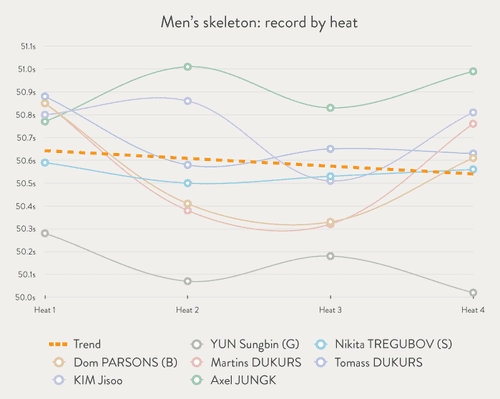
Skeleton is one of the few racing sports that require multiple runs through the same track. These run are called “heats”, and Olympic skeleton racers go through four of them to complete a competition. While watching the skeleton event, my intuition was that the records of each heat would improve as the competition progressed, since athletes had time to adapt to the track and the Olympic atmosphere. From the records of the final top 7 racers, a downward trend can indeed be seen. However, the magnitude of improvement is not large.
